







Naveen Raj Kanagaraj · Data & Business Analytics · Chicago · Seeking 2027 internships

Data and business analyst turning behavioral, revenue, and commercial data into clear decisions.

Five years translating behavioral, campaign, and revenue data into commercial decisions, backed by a Computer Science foundation and current M.S. study in Marketing Analysis at DePaul. I use SQL, Python, Tableau, Power BI, and GA4 to build KPI frameworks, analyze funnels, cohorts, churn, and experiments, and turn the findings into recommendations for founders and senior leaders, work that supported $1.8M+ in partnership revenue.

Portrait of Naveen Raj Kanagaraj
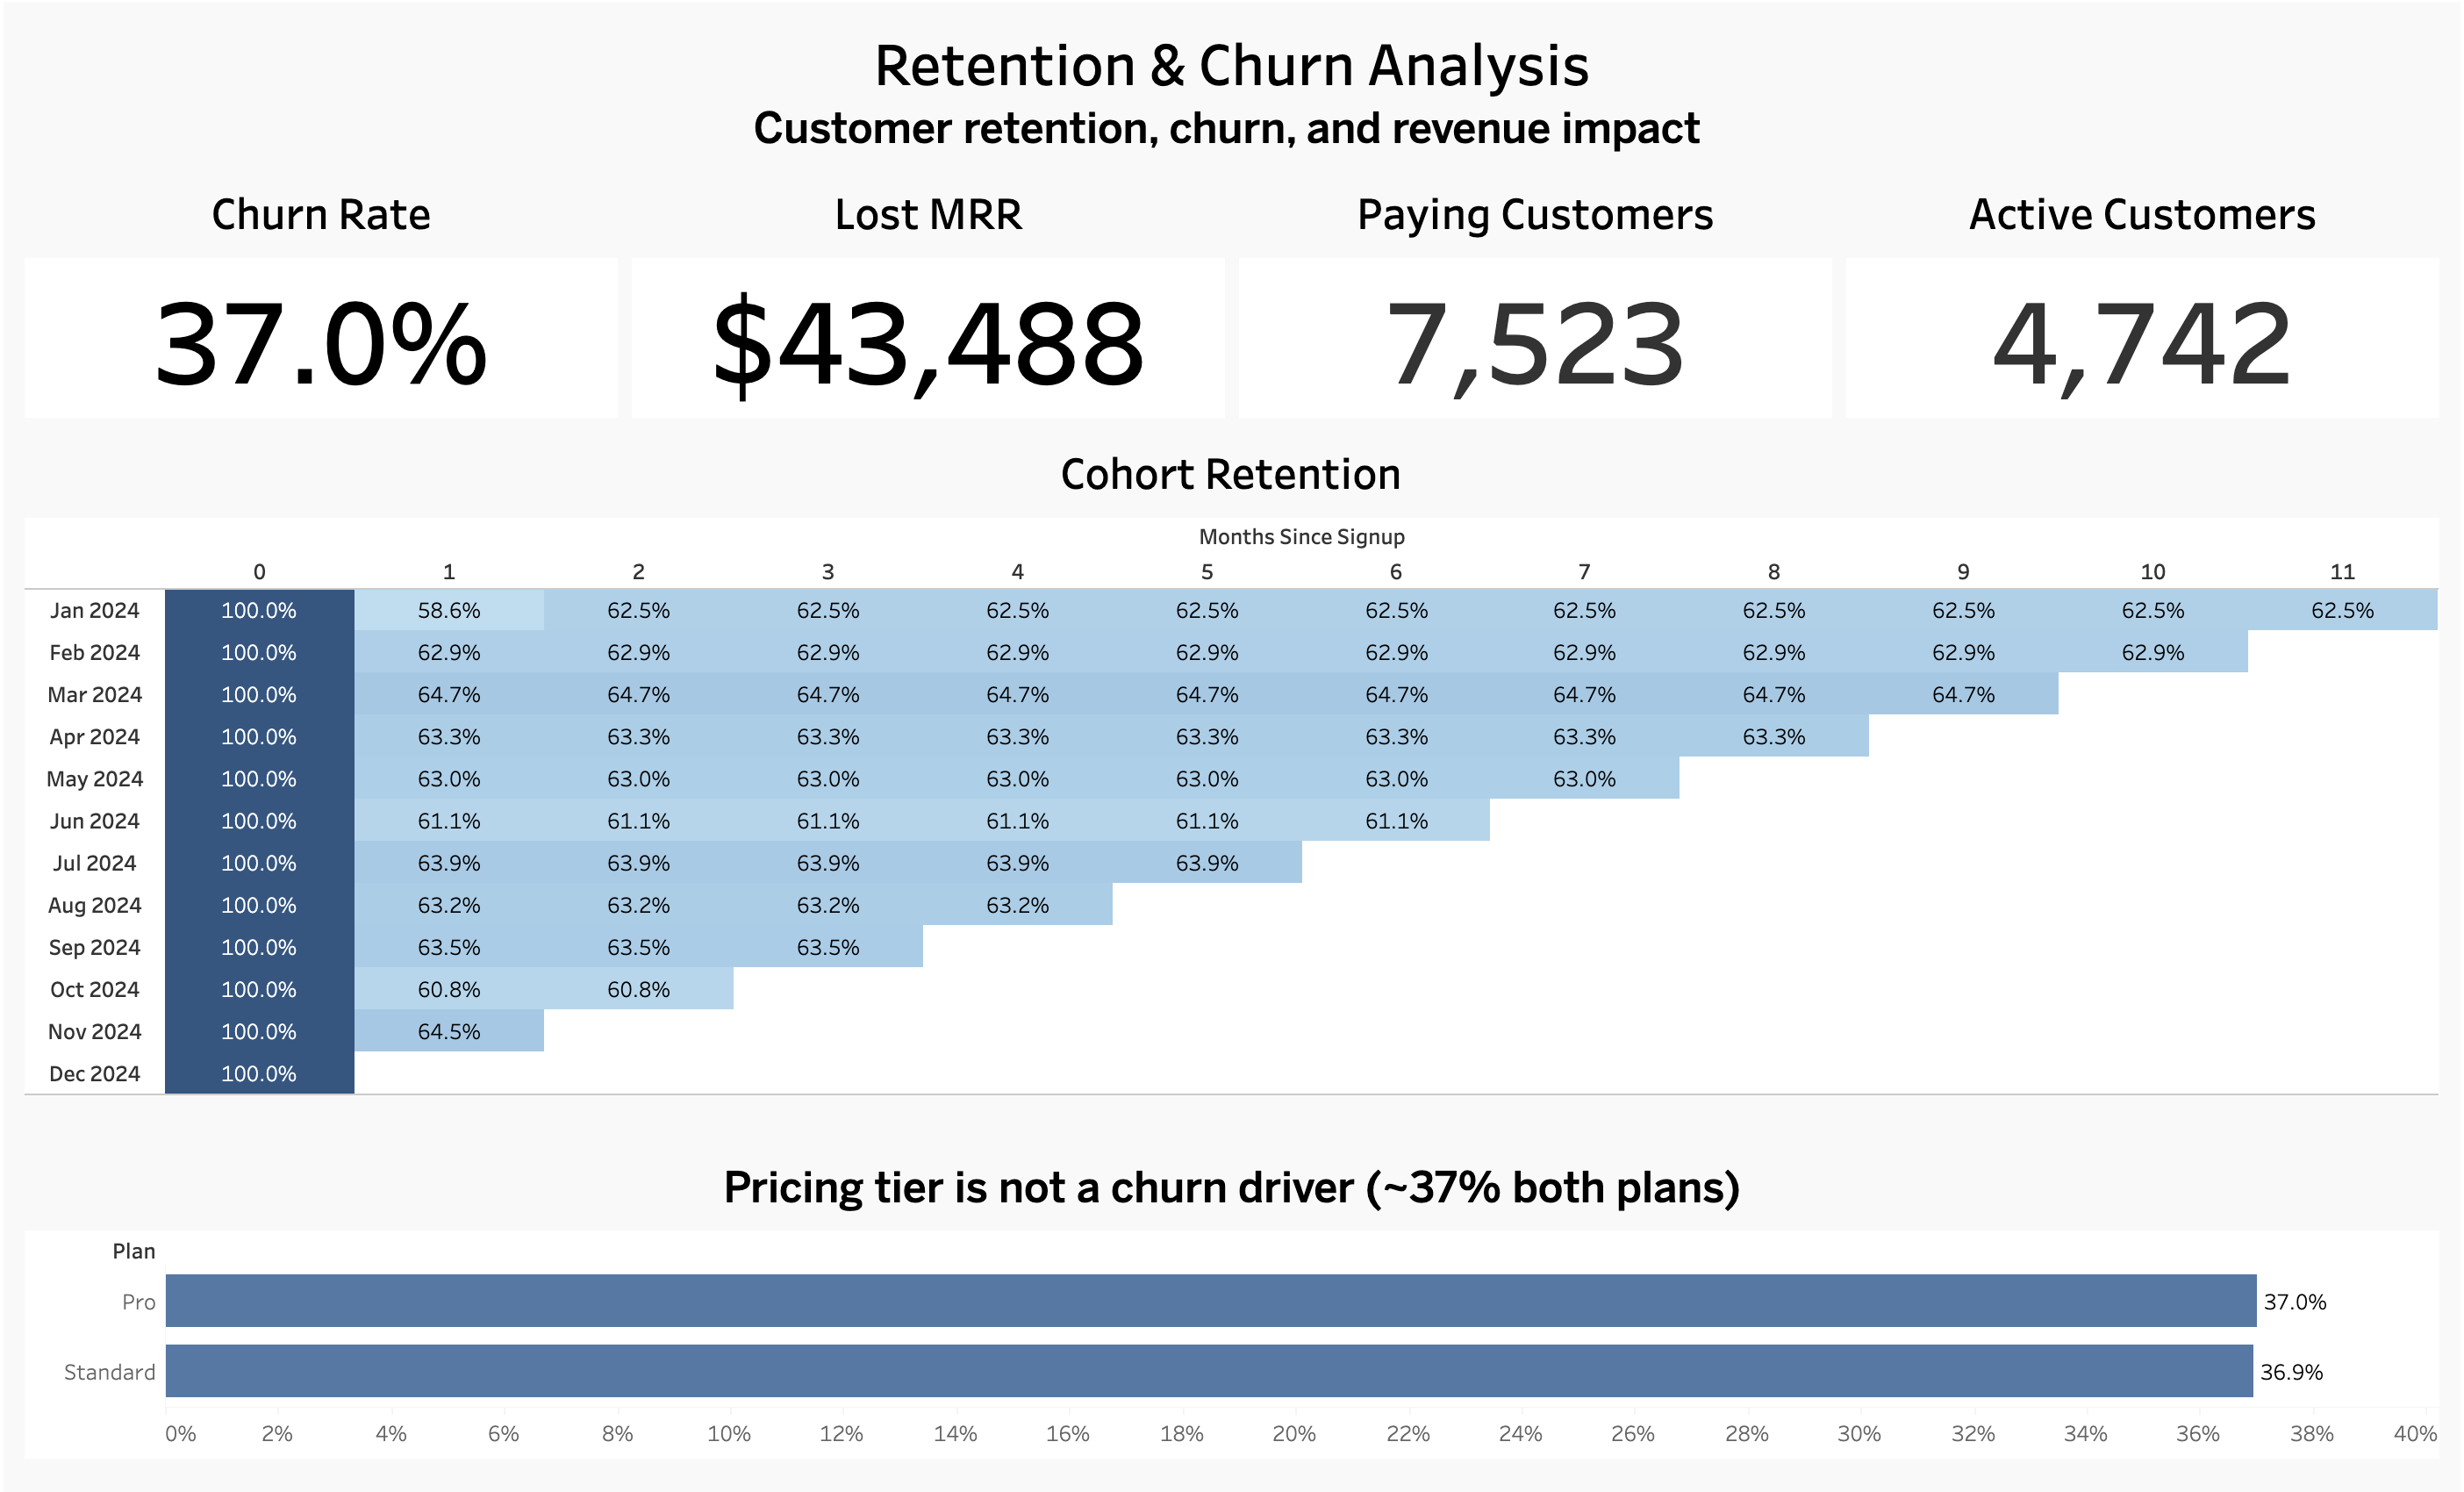
$43K
at-risk MRR surfaced
+2.9pp
A/B conversion lift · p<0.001
3×
organic engagement advantage
10%
bot traffic isolated & corrected
1,257
research responses analyzed
50+
interviews analyzed

Selected brands collaborated with

Samsung
Samsung
Intel
Intel
Krafton
Krafton
OnePlus
OnePlus
Sony
Sony
Philips
Philips
Cloud9
Cloud9
ASUS
ASUS
HyperX
HyperX
Tencent
Tencent
Acer
Acer
Jio
Jio
Supercell
Supercell

Selected collaborations and partnership activations. Brand names are used for identification only.

01 / Professional proof

Outcomes, not just dashboards.

The commercial context behind the analysis: revenue supported, audiences built, and partnerships closed across five years in live environments.

$1.8M+
brand partnership revenue
280K+
audience built
12M+
audience reached
3B+
cumulative impressions
$25K+
partnerships closed

02 / Experience

Experience where
data had to ship.

I have used dashboards, acquisition analysis, and audience intelligence in live commercial environments, where a recommendation changed the next move.

Entity GamingDigital Marketing Manager · Jul 2022 - Aug 2024

Turned campaign and audience data into commercial decisions.

Built the audience analysis and pricing model behind $1.8M+ in brand partnership revenue, using user composition and market position to set tier values. The organization booked the revenue; I supplied the analysis, pricing, and packaging evidence that informed it.

  • Consolidated campaign, revenue, and user data into monthly dashboards for founders and C-suite budget allocation.
  • Analyzed acquisition funnels and channel-level performance across India and Europe, segmenting the user base to identify which audiences drove partner value and sizing the spend reallocation behind the reach gain.
  • Helped drive 200% campaign-reach growth to 250M+ impressions across a 2M+ audience base by shifting toward higher-yield activity.
  • Managed a six-person content, design, and partnerships team using measured yield to prioritize execution.
LetsGrowEsportsFounder · Mar 2021 - Present

Built an owned audience and the measurement system around it.

Scaled from zero to 280K+ followers and 3B+ cumulative impressions, using A/B creative and distribution tests to compare reach, CTR, and engagement. Owned web reporting across 74K+ monthly users and built the KPI system around the audience.

  • Used GA4 acquisition and landing-page analysis to find organic search generated 3× higher engagement than referral traffic.
  • Isolated 10% non-human traffic with near-zero depth, corrected inflated reach, and reallocated investment.
  • Closed $25K+ in individual partnerships with Samsung, Intel, Krafton, and Sony through segmentation, modeling, and pricing recommendations.
  • Led a five-person team with KPI definitions, data-quality checks, and weekly performance reviews.

03 / Analytics case studies

Find the pattern.
Frame the choice.

Product, customer, and acquisition analyses with the method, evidence, recommendation, and next measurement made explicit.

40Kusers · 303K events

Featured / Product analytics

Subscription Product Analytics

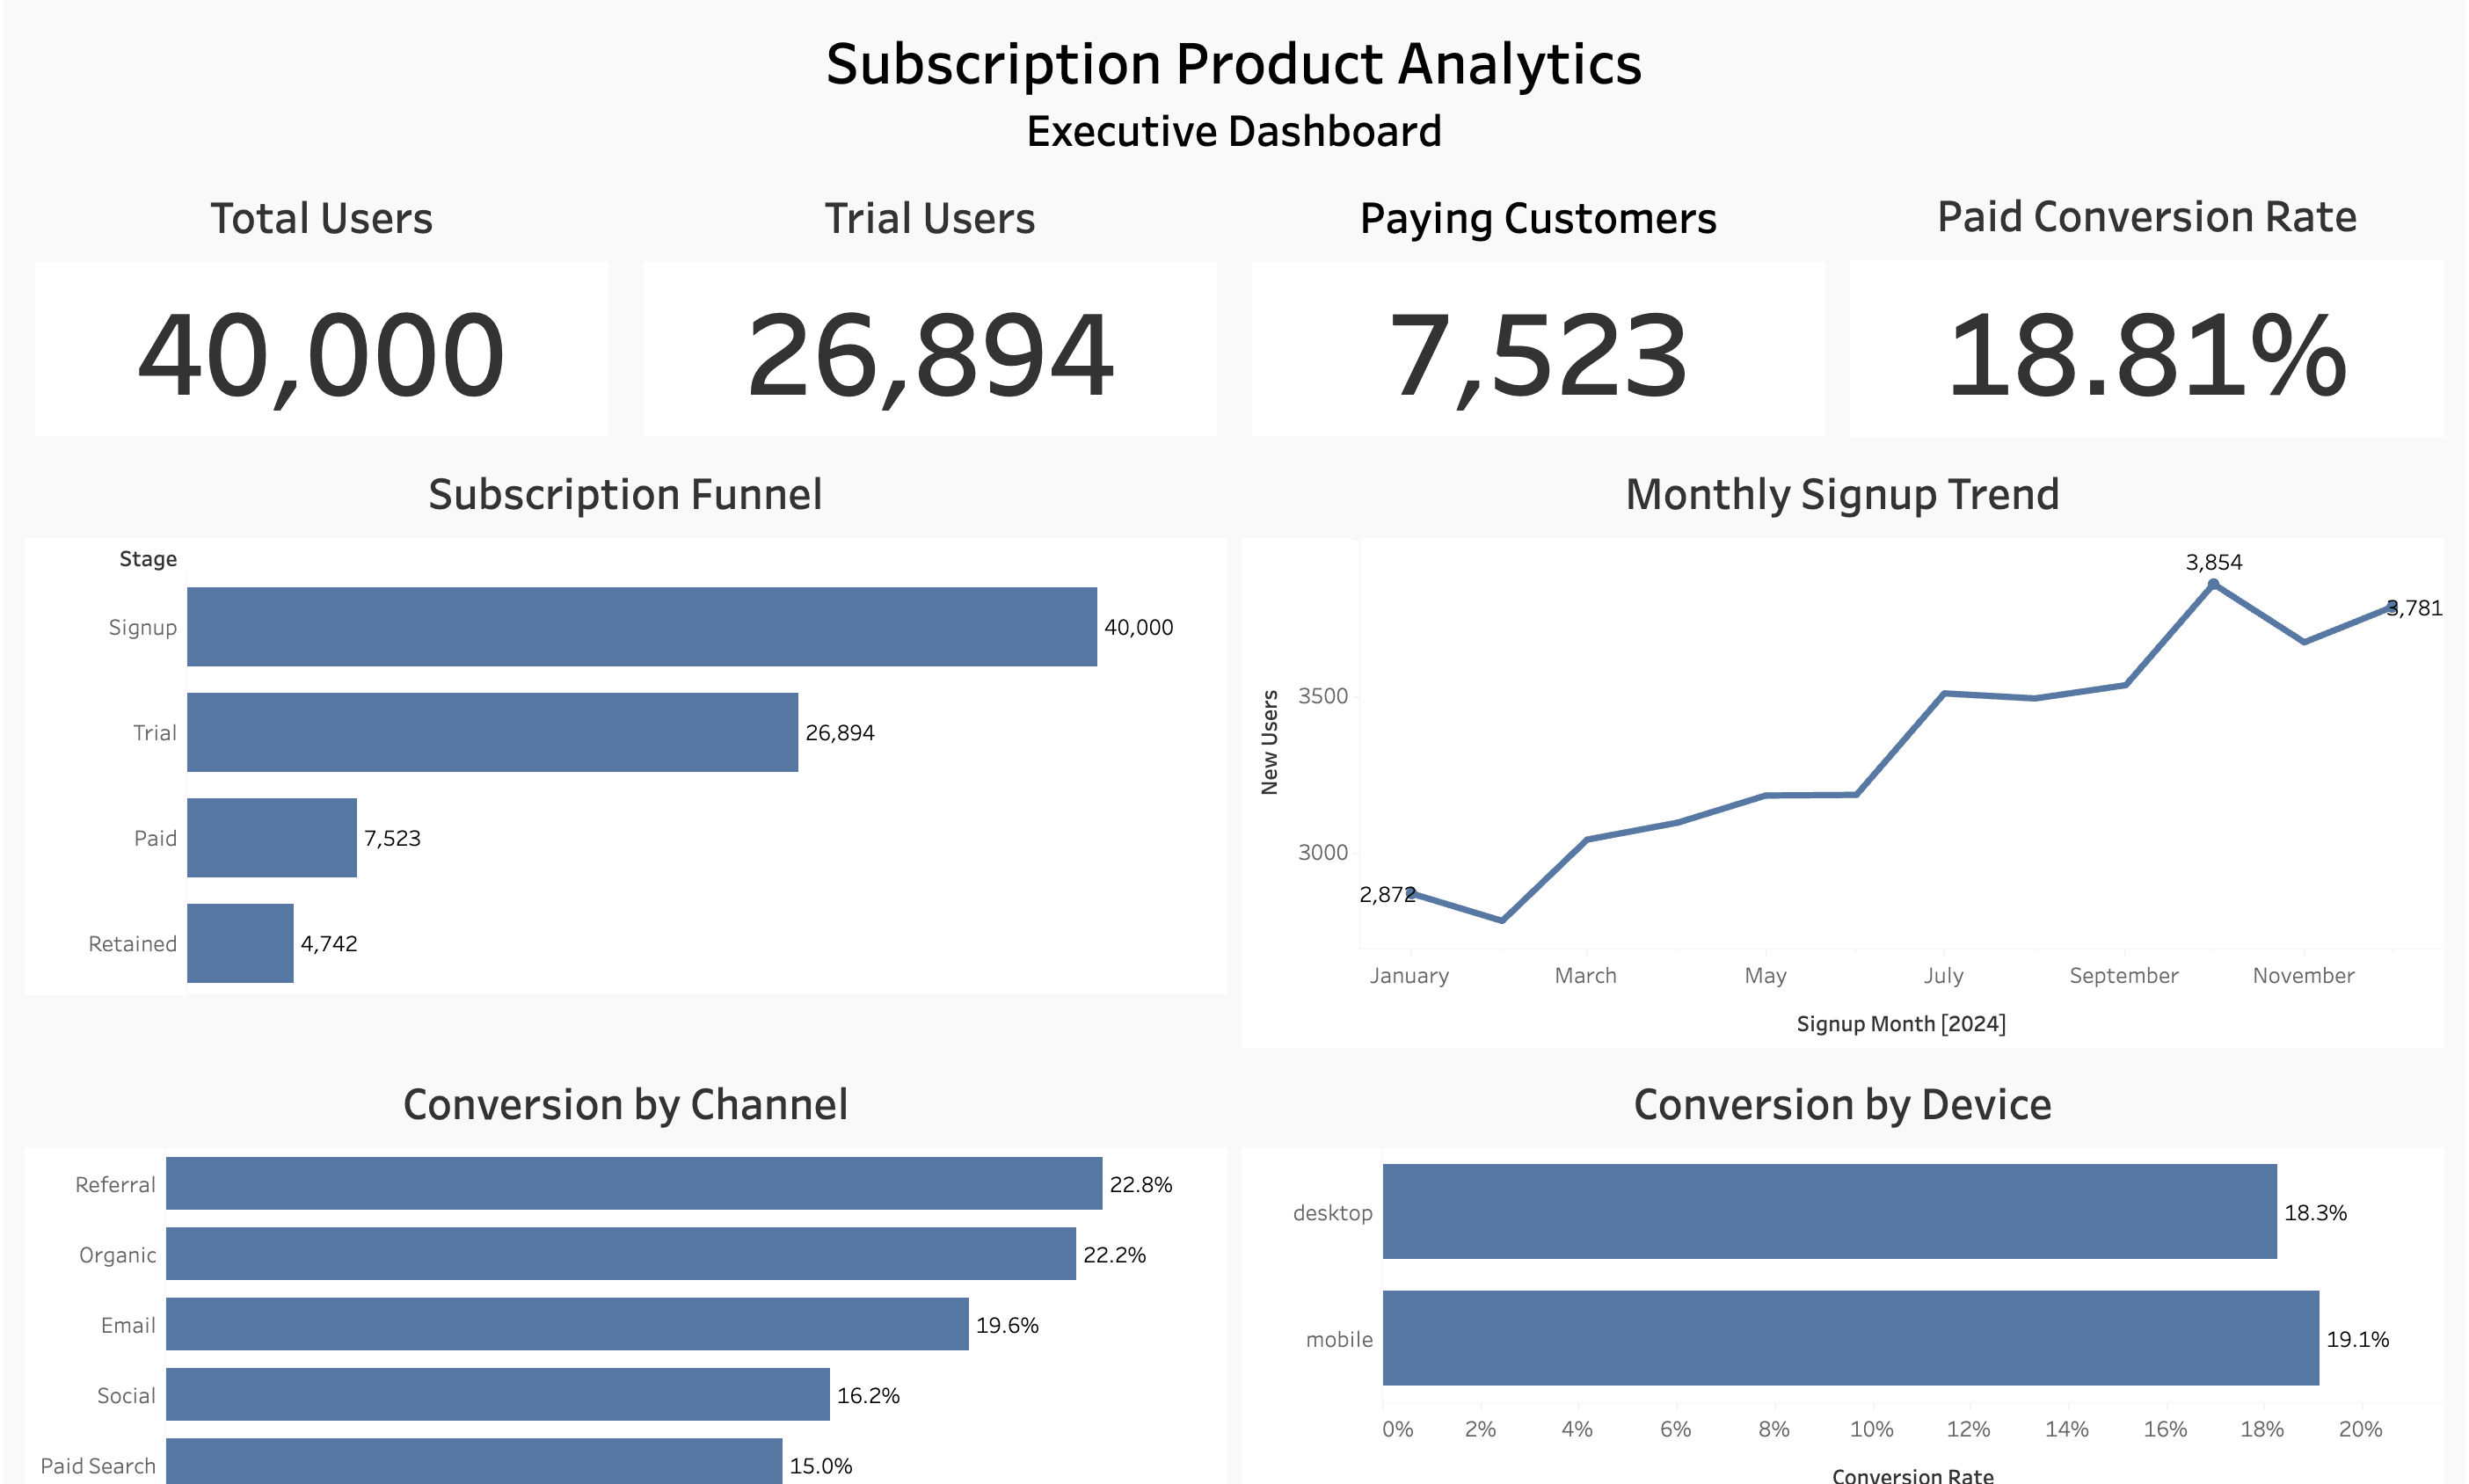
Queried 40K users and 303K events in SQL, then used Python and Tableau to diagnose trial-to-paid drop-off, churn, and onboarding priorities.

3.7vs 6.8 / 10 satisfactionRELIABILITY
IS THE SIGNAL.

Featured / Product research + analytics

Drivers of User Satisfaction

Synthesized 1,257 survey responses, 50 interviews, and behavioral evidence to show that reliability, not feature expansion, should lead the roadmap.

60K+website users · GA4QUALITY
OVER VOLUME.

Featured / Acquisition analytics

GA4 Audience & Acquisition

Audited 60K+ GA4 users, isolated 10% bot traffic, and found organic search generated 3× higher engagement than social, reshaping acquisition priorities.

From evidence to market decision.

The same analytical system can support a product fix, a positioning choice, or a launch test.

1,257user signals → product decision
Research→SQL + Python→Retention plan
RELIABILITY
EARNS RETURN.

Integrated analytics + product strategy

BGMI: User Insight to Retention Strategy

Connected user research, segmentation, and SQL/Python analysis to a measurable reactivation plan focused on reliable gameplay and return behavior.

DQpreference data → pricing decision
Conjoint→Python→Pilot plan
PRICE THE
PREMIUM.

Integrated analytics + commercial strategy

Dairy Queen: Premium Line-Extension Decision

Used conjoint analysis, pricing logic, and franchise constraints to turn willingness-to-pay evidence into a commercially viable premium-line pilot.

04 / Technical toolkit

Technical fluency,
applied.

I use the stack to answer product questions, validate a decision, and make the recommendation usable, not to decorate a skills list.

Languages & databases

Python Pandas · NumPy · scikit-learnSQL PostgreSQL · MySQL · CTEs · window functionsGit & GitHub version control · reproducible analysis

Visualization & BI

Tableau interactive dashboardsPower BI business reportingAdvanced Excel analysis and modeling

Experimentation & research

A/B testing hypothesis tests · guardrail metricsGA4 acquisition · funnels · user behaviorResearch methods Qualtrics · conjoint · perceptual mapping

05 / Evidence and tools

Show the
work.

Case studies explain the decision. Source material and dashboards let you inspect the analysis underneath it.

06 / Dashboard preview

The numbers behind
the decision.

Two views from Subscription Product Analytics: lifecycle performance and cohort retention. Open Tableau for the interactive workbook.

Computer science, business, and analytics working as one system.

My B.Tech. in Computer Science and Business Systems taught me to think in systems, data, and constraints. My M.S. in Marketing Analysis at DePaul adds the customer, market, and commercial layer. I use that fusion to isolate the signal, test what matters, and deliver a business recommendation people can use.

DePaul UniversityM.S. Marketing Analysis · 3.92/4.0 · Expected Dec 2027
Vice President, IT & Analytics · Kellstadt Marketing Group
Graduate Research Assistant · Department of Management & Entrepreneurship
Graduate Student Assistant · Department of Marketing
Saranathan College of EngineeringB.Tech. Computer Science & Business Systems · Nov 2021 – May 2025

Relevant coursework

Data, Statistics & AnalyticsMatrices and Calculus · Discrete Mathematics · Statistics and Numerical Methods · Probability and Statistics · Fundamentals of Data Science and Analytics · Exploratory Data Analysis · Business Analytics · Machine Learning
Computer Science & SystemsProblem Solving and Python Programming · Data Structure Design · Design and Analysis of Algorithms · Database Management Systems · Object Oriented Programming · Recommender Systems · Generative AI for Engineering
Business & EconomicsFundamentals of Economics · Business Analytics · Digital Marketing

08 / Actively seeking internships

Let's make
the signal useful.

Actively seeking internships for 2027 in product, data, and business analytics.
Chicago · Open to relocating · CPT eligible · STEM OPT eligible.